Understand the essential information and key financial metrics found on US stock market quote pages, with a clear explanation using GOOGL (Alphabet Inc. Class A) as a practical example. This guide breaks down complex terms for American investors seeking to grasp the fundamentals of stock analysis.
What Are the Basic Details on a US Stock Quote Page?
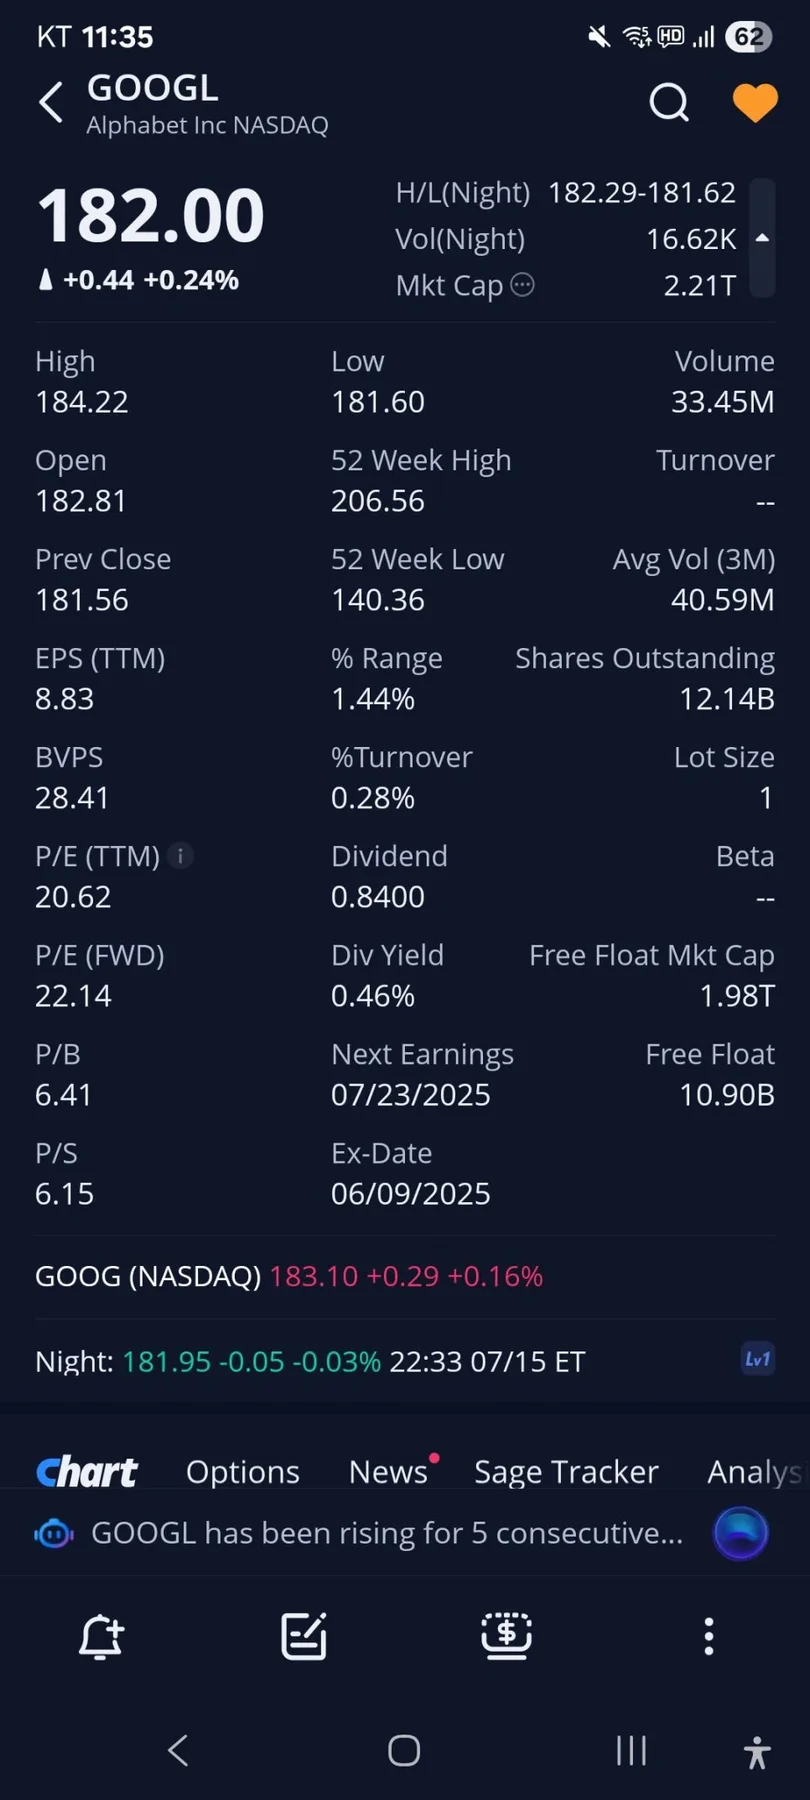
A US stock quote page provides a snapshot of a company's real-time performance and key financial data. For instance, when looking up GOOGL (Alphabet Inc. Class A) on a platform like Webull, you'll see crucial information at the top. This includes the current stock price, the day's high and low prices, trading volume, and market capitalization (Mkt Cap). The market cap, for GOOGL, stands at approximately $2.21 trillion, representing the company's total valuation. Note that some data might be unavailable during after-hours trading sessions.
Today's intraday high reached $184.22, with the low at $181.60. The total trading volume for the regular session was around 33.45 million shares. The opening price was $182.815. The 52-week high and low prices, $206.56 and $140.36 respectively, show the stock's price range over the past year. The average trading volume over the last three months (Avg Vol (3M)) is approximately 40.59 million shares, indicating consistent market activity.
How Do You Interpret Key US Stock Market Metrics?
US stock quote pages display various financial indicators vital for investment decisions. Earnings Per Share (EPS) TTM (Trailing Twelve Months) shows how much net profit a company generated per share over the last year; for GOOGL, this is $8.83. The total number of outstanding shares is 12.14 billion, and the Book Value Per Share (BVPS) is $28.41. Turnover, the ratio of daily trading volume to total outstanding shares, was 0.28% for GOOGL. The standard lot size for trading is typically one share.
The Price-to-Earnings (P/E) ratio TTM is 20.62, meaning the stock is trading at 20.62 times its earnings over the past twelve months. The annual dividend per share is $0.8400, resulting in a dividend yield of 0.46%. The Forward P/E ratio, which uses estimated future earnings, is 22.14. The Free Float Market Cap, representing the market value based only on shares available for public trading, is $1.98 trillion. The Price-to-Book (P/B) ratio is 6.41, and the next earnings announcement is scheduled for July 23, 2025.
What Should You Be Cautious About When Interpreting US Stock Metrics?
When analyzing US stock metrics, it's crucial to consider potential limitations. For example, while the P/E ratio is useful for comparing a company's valuation against industry averages or competitors, it doesn't account for growth potential or debt levels. Furthermore, TTM data reflects the past twelve months, so it's essential to review quarterly earnings reports to understand recent performance trends. Dividend-related figures are based on past payments and do not guarantee future payouts.
The Free Float indicates the number of shares actually available for trading, excluding those held by insiders or major stakeholders, which helps assess market liquidity. For GOOGL, the free float shares are approximately 10.9 billion out of 12.14 billion total outstanding shares. The Ex-Date, the last day to buy a stock to receive a dividend, was June 9, 2025, for GOOGL. While these metrics are valuable for assessing a company's financial health and value, investment decisions should always be based on comprehensive analysis.
What Additional Factors Should Be Considered with US Stock Metrics?
Beyond the basic information on a stock quote page, investors should conduct deeper analysis using a company's financial statements. Examining the difference between total outstanding shares and free float can reveal insights into insider ownership and share buyback programs, shedding light on corporate governance and shareholder policies. In addition to EPS and P/E, analyzing revenue growth rates, operating margins, and debt-to-equity ratios provides a more holistic view of a company's profitability and stability.
The Beta (Beta) metric measures a stock's volatility relative to the overall market; while not displayed for GOOGL in this example, a Beta greater than 1 indicates higher volatility than the market, and less than 1 suggests lower volatility. This deeper analysis is essential for accurately assessing a company's intrinsic value and managing risk for long-term investments. The specific metrics that are most important will vary based on an individual's investment goals and risk tolerance, making it advisable to consult with a financial advisor to develop a personalized investment strategy.
For more detailed US stock information, refer to the original source.